


A smart office is a work environment in which innovation enables employees to work flexibly, faster, and smarter. This article explains all you need to know about smart office statistics and trends.
Sensors, electronic devices, and versatile applications help employees complete tedious tasks faster and better, giving them more time to do creative work in organizations. Smart office technology makes jobs more efficient and flexible with the help of network-based devices.
Cloud storage, schedule management, improved customer satisfaction, risk management, resource utilization, and high investment returns are just a few of the advantages of smart offices.

Table of Contents
General Statistics
Smart Office Market Outlook
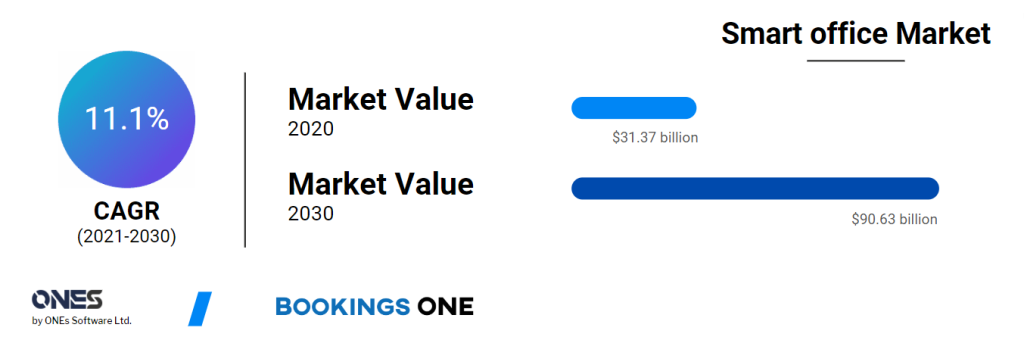
The global smart office market was valued at $31.37 billion in 2020 and is expected to reach $90.63 billion by 2030, growing at an 11.1% CAGR between 2021 and 2030.
Smart Office Furniture Market
The smart office furniture market share is expected to increase by USD 85.11 million from 2021 to 2026, and the market’s growth momentum will accelerate at a CAGR of 8.78%.
During the forecast period, North America will account for 47% of market growth. The smart office furniture market in North America is mostly concentrated in the US and Canada. The market in this region will expand more slowly than markets in other regions.
Lots of employers invest in hyperlocal offices to promote a return to the office
Since the pandemic, 64% have leased or are contemplating leasing suburban office space.
Employers have responded to the pandemic’s deurbanization of the workforce by investing in hyperlocal workplaces to encourage workers to return to the office. Employers think that the connection employees have within the actual workplace is worth the expenditure.
In addition to predictable flexibility, employers are investing in various routes to attract employees to come into the office, such as in-person activities (50%), offering lunches (45%), reimbursement for commuting costs (38%), and childcare assistance programs (33%).
(EY)
Segment Overview
Europe dominated the smart office market in 2020 and is expected to grow at a rapid pace during the forecast period, owing to the expansion of the retail and hospitality sectors. However, Asia-Pacific is expected to grow at a faster rate than Europe by the end of the forecast period.
Leading manufacturers in the smart office market, such as Honeywell International Inc., Cisco Systems, Inc., and Siemens AG, are focusing their investments on more technologically advanced, cost-effective, and secure products and solutions for various applications.
Top Impacting Factors
The increasing need for energy efficiency, as well as supporting industry standards and regulations, are major factors influencing the growth of the smart office market.
Furthermore, the smart office market is being driven by the growth of the IoT market and its applications. However, the high initial investment limits market growth. On the contrary, the evolving smart city market is expected to generate lucrative opportunities for the market.
COVID-19 Impact Analysis
The COVID-19 outbreak has had a significant impact on the electronics and semiconductor industries. Due to an increase in the number of COVID-19 cases, business and manufacturing units in various countries have been closed and are expected to remain closed in 2021.
Furthermore, the partial or total lockdown has disrupted the global supply chain, making it difficult for manufacturers to reach their customers.
The COVID-19 pandemic is having a global impact on society and the economy. The impact of this outbreak is growing by the day and is affecting global business.
Manufacturing unit shutdowns in Asian and European countries have resulted in significant business and revenue losses. The outbreak of the COVID-19 disease has had a significant impact on the operations of the production and manufacturing industries, which has hampered market growth.
Technology helps
Using voice, video, and content sharing to communicate with distant parties, 74% of APAC respondents do so.
60% of APAC respondents said they would use collaboration technology if made available in small meeting rooms.
(Polycom)
Office Data Insights
The most useless thing in the post-pandemic office
What’s the most useless thing in the post-pandemic office?
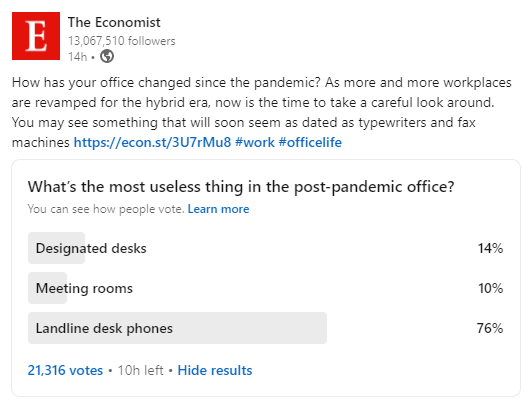
Based on The Economist poll, 76% of respondents think that Landline desk phones are the most useless thing in the post-pandemic office, while only 10% of them think meeting rooms are useless.
(Source)
Cost of running an office space for 100 employees
The cost of running an office space for 100 employees (totaling a complete office space of 20,000 sq. foot) in:
- New York could cost as much as $4 million annually,
- London, it could cost $3 million annually,
- San Francisco $2.8 million annually and,
- Madrid $1.5 million annually.
In Singapore, the median rent for traditional office space in Singapore in the first three months of 2021 ranged between $2.51 and $7.95 per square foot per month, with a total of 665 leases signed, according to data made public by the authorities.
Accordingly, a typical office space of 20,000 square feet would cost between $60,2400 to $1.9 million per month.
The ratio of office room to people
With no fixed seats (such as activity-based working or hot-desking) and 80–150 square feet allotted for each employee, high-density workplaces are typically flexible work environments.
Workplaces with an average staff density (150–250 square feet) typically have a standard office design with a mix of individual workstations and private offices.
The typical conference room-to-employee ratio in workplaces with higher densities is 1:10, whereas it is more like 1:20 in offices with dedicated workstations.
Office Type: retrofit and new construction
The market has been divided into two categories: retrofit and new construction. By 2025, the retrofit segment is expected to generate the most revenue. The growing need for energy-saving technologies in retrofitted offices can be attributed to the segment’s growth.
Over the forecast period, the new construction segment is expected to grow significantly. Modifications or new system implementations may be limited in a retrofit office. However, new construction allows for greater flexibility in implementing new systems.
Average office occupancy
After two years of covid ance and mainly flat leasing, the worldwide office providers interviewed for the MatchOffice Industry Survey 2022 in May express their considerable optimism about the market future generally.
The respondents from North America had the highest expectations; of them, 46.6% think things will turn out well, and 39.1% are excited about the outlook for the office rental market after the pandemic.
Comparatively, the figures for European providers reveal 41.2% and 35.1%, while 32.8% and 31.7%, respectively, are slightly below projections for Asian providers.
In Sweden (72.1% and 17.5%), Germany (65.2% and 21.1%), the Netherlands (77.3% and 10.1%), and Denmark (45.9 and 33.4%), office landlords in Europe are currently quite optimistic about the market.
( MatchOffice Industry Survey )
The pandemic had a severe impact on U.S. commercial real estate (CRE), with vacancy rates skyrocketing in all key sectors, including multifamily, industrial, retail, and office, in the early stages of the health catastrophe.
Rent and price rises were also hampered by deteriorating fundamentals. These pressures, however, were short-lived for the industrial and multifamily sectors, as they saw their vacancy rates reverse course and drop to far lower levels than they were before the epidemic.
On June 22, the commercial vacancy rates are mostly below the pre-pandemic level, except for the office sector.
Office occupancy compared to last year
More than 45% of respondents report their office occupancy is higher than last year (2021). 23.1% of them had the same occupancy in 2021.
( MatchOffice Industry Survey )
U.S Office Vacancy Rate
Due to a significant shift in the labor force toward remote work during the pandemic, office foot traffic was significantly reduced.
Although wealthy tech behemoths expressed interest in prime office spaces, the epidemic significantly curbed most firms’ desire to sign new office contracts. Two years into the pandemic, the office sector’s vacancy rate has moved sideways after peaking at 12% in mid-2021, making little improvement.
Readiness of cutting office space
Firms are currently not planning to cut office space too much.
In the US, the impact of COVID only reduced 1% of office space, while 10% of office space has been diminished in the UK.
(Stanford)
Meeting room demands
According to new data from Coworker.com, global meeting room demand within flexible office spaces is up 73% from 2020.
A survey by Randstad US and Future Workplace found that 80 percent of workers say virtual communication has made them more reactive than strategic in their daily work.
Especially for new employees, pointed out that they need a face-to-face conversation with an experienced in a meeting room to have an immediate solution to their problems.
(Randstad)
Conferences Insights
The average number of video conferences
Most video conferences occur in the marketing and advertising industry, where each worker attends 20.9 sessions on average per month.
Followed by businesses in the travel sector, which hold an average of 11.1 meetings every month. Tech firms, with an average of 10.5 meetings each month, are in third place.
In general, businesses tended to follow the same pattern: a rapid increase following the epidemic, followed by a gradual decline, maybe as they started relying more on asynchronous communication to counteract the tiredness caused by video conferencing.
Companies in the top end of the mid-market segment with 751 to 1,000 employees saw a more consistent downward trend with fewer rises.
In a similar vein, enterprise enterprises with 1,001 to 10,000 employees initially increased before declining in the Fall of 2020 and then peaking once more in March of 2021.
Larger businesses employing more than 10,000 workers experienced a delayed increase, which peaked in May 2021:
(dialpad)
Time spent in video conferences
Video conferencing is used by 46.15% of respondents for less than four hours per week, and by 36.98% for four to twelve hours.
According to this, 83.13% of people attend meetings for no more than 12 hours every week. The 4.73% who spend more than half their week working, on the other hand.
(dialpad)
Number of Meetings vs. Number of Attendees
The information we gathered indicates that gatherings are smaller than you might anticipate.
Meeting rooms were frequently only used by one person in the roughly 6,000 meetings that “Density’s Mid-Year 2019 Workplace Utilization Index” examined during the busiest times of the day.
(Density)
Usage By Meeting Group Size
The report “Density’s Mid-Year 2019 Workplace Utilization Index” exemplifies the significance of monitoring space consumption as a way to enhance meeting room allocation. The research reveals inconsistencies between meeting rooms’ actual usage and their design:
- Meetings with two to four participants made up about 40% of all meetings.
- Only 6% of meetings had more than 10 participants, while 85% of meetings had less than seven attendees.
- Even the largest gatherings rarely occupied more than 45% of the available space.
(Density)
Cost of Meetings

An hour-long discussion with five participants (ranging in rank from specialist to director) costs $338 USD in salaries.
All of those video calls cost money as well. The time lost on useless ones will still cost each employee $1,250 every month.
(booqed)
Methods to Connect
Despite technology’s dominance, physical connection still has value, especially now that face-to-face interactions are limited because of the pandemic. Face-to-face meetings are preferred above alternative formats by 76% of professionals.
They believe that critical decisions are simpler to make. They also concurred that meeting in person improves their comprehension of the recipient party.
- Conferencing is preferred by 7%.
- 5% favor video calls.
- 4% favor email/instant messaging.
(Doddle)
Meeting Room Insights
Time wasted when finding rooms
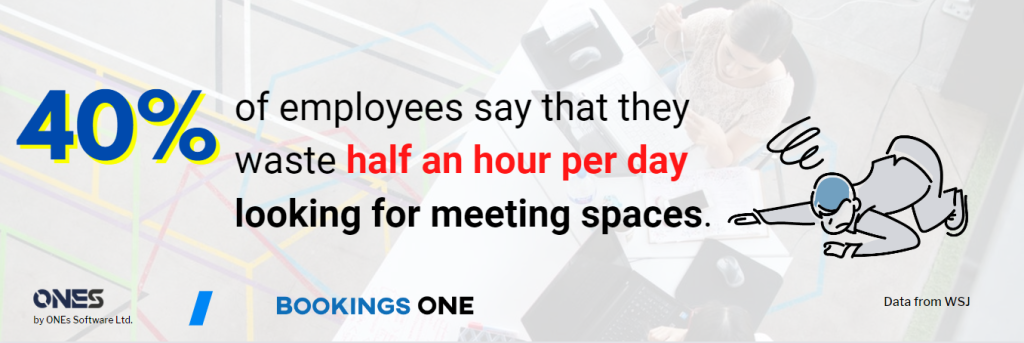
40% of employees say that they waste half an hour per day looking for meeting spaces.
(WSJ)
Meeting room utilization
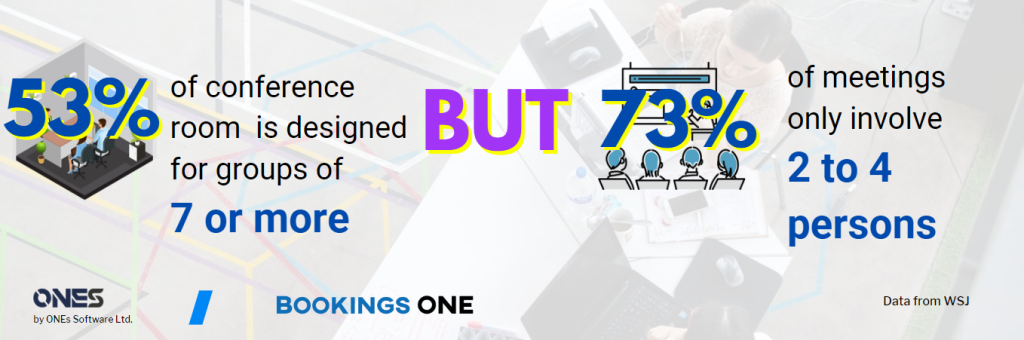
Although 53% of conference room space is designed for groups of seven or more, 73% of meetings only involve two to four persons.
(WSJ)
Unused Space in Meeting Rooms
Based on the report “Density’s Mid-Year 2019 Workplace Utilization Index“, small rooms (2-4 people) are seldom wasted by people, while over half of the extra large rooms (13+ people) have been wasted.
(Density)
Exceed Capacity and Wasted Space
According to the research in “Density’s Mid-Year 2019 Workplace Utilization Index“, the largest meeting rooms might be cut in half and still accommodate the daily needs of the workforce.
This translates to an annual waste of space costing close to $1.4 million across 100 rooms with 400 square feet each built for 20 people.
An additional $2.8 million may have been saved during the first fit-out.
Over the course of six months, the combined capacity of large and extra-large conference rooms was exceeded 24 times, each time for just over 30 minutes. Or, to put it another way, for a total of 14 hours over the course of six months, these rooms were crowded. These are mainly used for a board meeting or training sessions.
Density suggested that it’s possible that extra-large meeting rooms go unused. However, you truly need them when you need them. Take into account tightening schedules and condensing down to a minimal number of extra-large places.
(Density)
Guidance for sizing spaces
According to the research in “Density’s Mid-Year 2019 Workplace Utilization Index“, despite being intended to accommodate much more people, the data clearly demonstrates that conference rooms were frequently only used by one person. In contrast, meetings with more than 10 participants were rarely held in spaces designed for that many people.
Density has suggested some clear guidance for sizing spaces to achieve higher workplace utilization if you have 10 meeting rooms for people based on the data:
- 3 quiet areas or phone booths for 1 person;
- 4 meeting rooms for 2 to 4 people;
- 1 meeting room for 5 to 6 people; and
- 2 flexible 20-person rooms that can be converted into 2 rooms for up to 10 people each.
(Density)
Regional Insights
General CAGR
Because of its large customer base and well-established manufacturers, the North American region is expected to dominate the market over the next eight years. The region generated the most revenue in 2016, and it is expected to grow at a CAGR of more than 10% between 2017 and 2025.
Because of the presence of growing economies such as China and India, the Asia Pacific region is expected to see a significant shift in its growth, with a CAGR of more than 19% from 2016 to 2023.
Growth in the service sector in these economies is expected to lead to an increase in the number of offices in the region, necessitating the establishment of smart offices from 2016 to 2023.
Over the forecast period, the South American market is also expected to grow significantly. Various factors, such as increased Internet and wireless network penetration, are expected to drive the regional market for smart offices.
Asia Pacific (APAC) region
The Asia Pacific (APAC) region will have the highest CAGR in the smart office market.
During the forecast period, the APAC market is expected to grow at the fastest CAGR. The adoption of energy management solutions to reduce associated costs, as well as the implementation of security and lighting management solutions in workplaces, are driving the growth of the APAC smart office market.
Product Insights
10+ Smart Office Options to create the best workplace experience
After the pandemic, there has been a significant amount of change, much of it negative, but there have also been some positive changes, particularly in the office area.
With the advent of the smart workplace and all its advantages, the dullness of the conventional, drab office is finally being challenged.
- Hot desks
- Conference/ Meeting Rooms
- Internet of Things (IoT) solutions
- Visitor management system
- Modern video monitoring
- Smart climate and lighting control
- Cloud-based smart office system
- Gamification
- Indoor 3D maps
- Voice Control
- Cybersecurity
The market for new construction offices to grow with the highest CAGR
Between 2017 and 2023, the new construction office type is expected to grow at the fastest CAGR. New construction offices offer the advantage of designing and implementing smart office solutions early in the construction process, resulting in lower operational costs and more efficient use of available resources.
Opportunity in evolving cloud-based environment of IoT platforms
IoT is a technology that stores, manages, and analyzes data in real time. Cloud platforms provide a cost-effective and easily deployable alternative to building on-premises data centers.
While IoT is all about connected devices that generate a large amount of data, cloud platforms allow analytics to extract value from that data. Cloud computing technologies enable smart office solution providers to connect workplace management systems installed in the control center to IoT-enabled devices. This capability will enable end users to quickly and affordably build an IoT-based sense and response system.
The cloud platform is a secure platform for the storage and computation of large amounts of data. Furthermore, the cloud can provide a unified platform for managing the service life cycle and organizing deployment.
The emergence of IoT Platform as a Service (PaaS) has increased the deployment opportunities for IoT solutions across the workplace infrastructure.
The cloud platform can aid in the deployment of various applications that offer workplace management authorities new methods of connecting traditional information systems to IoT-enabled devices.
Definition
Space occupancy
occupied square footage/total workspace square footage = space occupancy rate
Simply divide the occupied floor space by the total floor space to determine the space occupancy rate (this means excluding restrooms, pantries, and other non-workable areas, but includes meeting rooms).
Space utilization
occupancy/ capacity = space utilization rate
Space utilization is your building’s occupancy divided by its capacity. It is seen by how frequently workers use a specific area.
Utilization can be both a static and a dynamic metric. For instance, you may assess how well a room is being used right now or over the course of a few days, weeks, months, or even hours.